Spreadsheets that are a week old aren't analytics — they're post-mortems. ManagedPMO's dashboard is live, per-property and portfolio-wide, so you catch problems while you can still do something about them.
Billed, paid, outstanding, with ageing buckets.
Units occupied vs. available, by property and floor.
Open, in-progress, breached SLA — in real time.
Consumption trends, variance vs. provider bill.
Inflow and outflow, reconciled or pending.
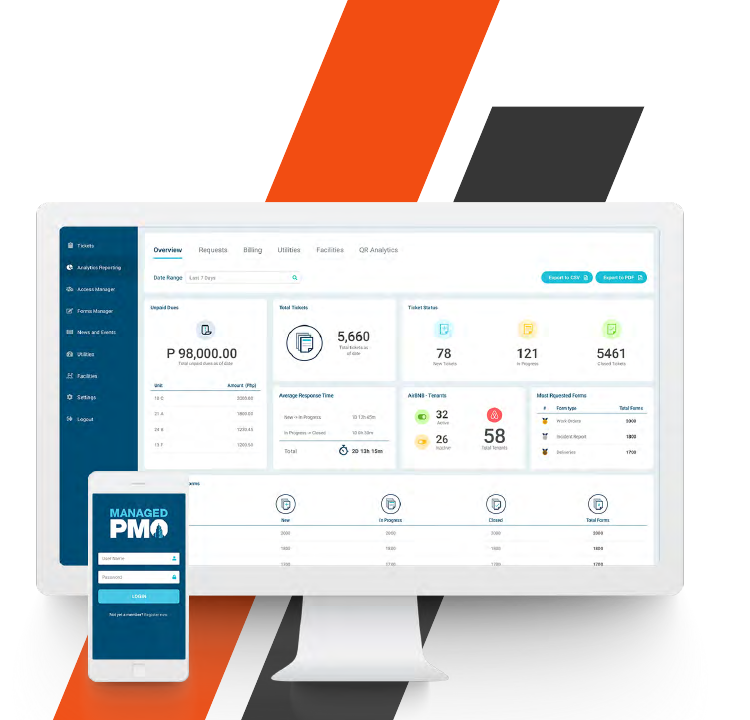
One login. Filter by property, region, asset class. Drill down into a tower, then a floor, then a unit. Every number is live and traceable to its source transactions.
For every view. Brand-tagged for board packs.
Auto-delivered to stakeholders at the cadence you choose.
Notify when collections drop below 85%, tickets exceed 20 open, or consumption spikes.
Pipe ManagedPMO data into Power BI, Tableau, or your own BI stack.
Yes — board-view, ops-view, and executive-view are all configurable.
Yes — scheduled data export or live API.
Live. Transactional data refreshes on commit; aggregate reports update within seconds.
Yes — scheduled PDF reports, and read-only dashboard links with optional expiry.
We'll load a sample of your data and show you the live KPIs in under 20 minutes.
Request a demo